
Proud to be Powered by Vontier. Sharing a united vision that is driven by innovation. Find out more
Whether you are measuring inventory by dipping tanks or with an automatic tank gauge, the stick or probe measurements are only as good as the tank chart that you reference when calculating the ullage. While tank charts do not cause a loss of fuel, an inaccurate tank chart will affect inventory and delivery data collected and could contribute to masking actual fuel losses. In fact, many discrepancies in fuel recording and variance reporting are the result of poor data capture because tank charts do not accurately represent how fuel is situated in the tank.
There are many potential reasons that a tank chart could be in error:
- The tank may have tilted since installation.
- There could be errors or changes to the initially reported end shape, diameter, or length.
- Additional support structures added around the tank may be effecting its shape
Tank manufacturers provide charts to match the tank specifications at the time of installation, and there are multiple online tank chart generators should the original chart be lost. Unfortunately using these charts rely on knowing the tank dimensions and shape exactly, understanding how the tank is oriented, and making some prediction of the effect installation and settling has had.
A more accurate way to automatically generate a tank chart is to use AccuChart on your Veeder-Root TLS Automatic Tank Gauge or QuickChart through Insite360 Advanced Variance Analysis service. These applications calibrate as fuel is dispensed, track data sufficiency, and report back when there is a statistically significant data set for creating an accurate tank chart.
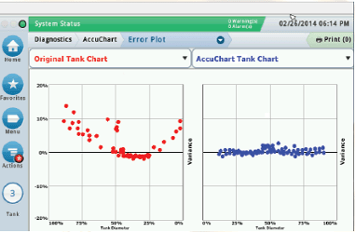
The Original Tank Chart shows a wide scatter of variance measurements, but with AccuChart the error in the reported variance is eliminated across the entire diameter of the tank. Read more about Business Inventory Reconciliation product for more information.